
D.1.1 Vectors and Matrices
If you opened this appendix, it is probably because a formula in the main text slowed you down. Maybe it was an expectation symbol inside a Bellman equation, a KL divergence term inside PPO, or the gradient operator that suddenly appears in the policy gradient theorem.
These formulas can look intimidating, but the underlying tools are not that many: scalars, vectors, matrices, probability, expectation, derivatives, gradients, entropy, and KL divergence. Once you understand what each word means, and how they combine inside reinforcement learning formulas, the notation becomes far less mysterious.
This appendix does not organize math by algorithm. It follows a more natural learning order:
mathematical objects -> linear operations -> probability and expectation -> stochastic estimation -> recursive equations -> optimization and gradients -> distribution distance -> full RL formulas.
Learning Route
The whole appendix can be summarized as one line:
mathematical objects -> linear algebra -> probability and expectation -> stochastic estimation -> Bellman recursion -> optimization and gradients -> distribution distance -> RL derivations.
Appendix Map
| Section | Topic | Main question |
|---|---|---|
| D.1 Mathematical objects and linear algebra | scalars, vectors, matrices, dot products, norms, linear equations | How do we write states, values, and parameters as computable objects? |
| D.2 Probability, expectation, and stochastic estimation | probability, conditional probability, random variables, expectation, variance, sampling | How do random trajectories become average value? |
| D.3 Calculus and optimization | derivatives, gradients, chain rule, Taylor expansion, optimization algorithms | Which direction should parameters move? |
| D.4 Information theory and distribution distance | self-information, entropy, cross-entropy, KL, mutual information | How do we measure policy randomness and policy change? |
Suggested Reading Order
If you want to rebuild the mathematical foundations systematically, read in this order:
- D.1.1 Vector and matrix basics: understand scalars, vectors, matrices, and matrix multiplication.
- D.1.2 Bellman equations in matrix form: see how value recursion becomes a linear system.
- D.2.1 Probability, conditional probability, and expectation: learn random variables and expectation.
- D.2.2 Random trajectories and state value: connect expectation to returns and value functions.
- D.2.3 Monte Carlo and importance sampling: estimate values from samples when the environment model is unknown.
- D.3.1 Derivatives, gradients, and the chain rule: understand parameter changes and backpropagation.
- D.3.2 Policy gradients and advantage functions: apply gradients to policy optimization.
- D.4.1 Self-information, entropy, and exploration: understand policy randomness.
- D.4.2 Cross-entropy and KL divergence: understand distances between distributions.
- Finally, return to each module's formula summary and exercises.
If you only need one concept, it is completely fine to jump directly to the relevant page.
A Running Example
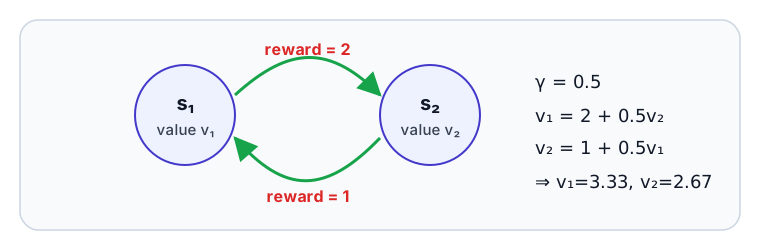
Several sections reuse the same tiny two-state environment. There are two states, and :
- in , the agent receives reward , then moves to
- in , the agent receives reward , then moves back to
- the discount factor is
Let the state values be and . Intuitively:
This same example plays different roles in different modules:
- in linear algebra, it is a two-variable linear system
- in probability, it is "immediate reward + expected next-state value"
- in stochastic estimation, it can be approximated from sampled trajectories
- in optimization, it becomes a target for a value network or policy network
- in information theory, it connects to policy distributions, exploration, and update constraints
If you can translate a complicated formula back into this two-state example, math stops being a wall and becomes a tool.
How to Use This Appendix
The sidebar divides the content into four math modules. You do not need to read everything at once. There are three useful modes:
- Systematic catch-up: start from D.1.1 and read in order.
- Just-in-time lookup: if Bellman matrix form is confusing, read D.1.2; if GAE is confusing, read the probability and calculus sections; if KL constraints are confusing, read D.4.2.
- Quick review: use each module's formula summary and exercises after finishing the corresponding topic.
If the sidebar feels too large, read only the first page of each module first:
- D.1.1 Scalars, vectors, and matrices
- D.2.1 Probability, conditional probability, and expectation
- D.3.1 Derivatives, gradients, and the chain rule
- D.4.1 Self-information, entropy, and exploration
After these four pages, return to the detailed topics whenever a formula in the main text needs support.
Chapter 3 introduced the Bellman equation , which describes the value of a single state. In actual computation, however, three problems appear in sequence: how to express the equations for all states at once, how to approximate values when the state space is too large, and how to keep the iterative process stable. Module D.1 shows the linear algebra tools that answer each problem and how those tools build on one another.
Content Overview
| Problem | Difficulty | Mathematical tool introduced | Key formula | Link to Chapter 3 |
|---|---|---|---|---|
| Too many equations | 1000 states = 1000 equations | Vectors, matrices, linear systems | v = (I - gamma P)^-1 r | Mathematical core of DP |
| State space too large | Too many states for a value table | Dot products, norms, function approximation | v_hat(s) = w^T x(s) | Mathematical core of DQN |
| Training stability | Training may diverge, explode, or drift | Eigenvalues, weighted norms, trust regions | rho(gamma P) <= gamma < 1, Delta theta^T F Delta theta <= delta | Mathematical core of PPO |
Reading Path
| Article | Question it answers | Corresponding problem |
|---|---|---|
| D.1.1 Scalars, Vectors, and Matrices | How do we represent states, values, and transitions? | Too many equations, basics |
| D.1.2 Matrix Form of the Bellman Equation | Can 1000 Bellman equations be compressed into one? | Too many equations |
| D.1.3 Dot Products, Norms, and Function Approximation | What if there are too many states to store? How do we measure update size? | State space too large |
| D.1.4 Convergence, Eigenvalues, and Trust Regions | Will training explode? How can parameters be updated safely? | Training stability |
| D.1.5 Formula Review and Exercises | Revisit Chapter 3 from this perspective | Full review |
Read D.1.1 through D.1.4 in order, then use D.1.5 for review and practice. If a concept is already familiar, you can jump directly to the corresponding article.
Prerequisites: This article does not require prior linear algebra. Read the two-state running example above first.
Scalars, Sets, and Functions
A scalar is a single number. A reward is a scalar, and a discount factor is also a scalar. In RL, the following values are all scalars:
| Symbol | Meaning | Typical values |
|---|---|---|
| r | Immediate reward | 2, -1, 0.5 |
| gamma | Discount factor | 0.9, 0.99, 0.5 |
| alpha | Learning rate | 0.001, 3e-4 |
| epsilon | Exploration rate or clipping range | 0.1, 0.2 |
A scalar gives the numerical value of a reward. Another basic element of an environment is the state. The collection of all possible states forms a set.
A set lists all possible elements inside braces. For example, a small environment may have three states and two actions:
The calligraphic letters and are conventional; writing and would not change the meaning. When we discuss "the value under state ," that must come from some set .
A set defines the available states. Next, we need to assign a value to each state, which leads to the idea of a function.
A value function takes a state and returns a number:
The notation means:
- says that is a function from to . The colon gives the type declaration, and the arrow gives the domain and codomain. is the set of real numbers.
- says that input is mapped to output .
In plain language, given a state , the function returns a number . For example, means that the value of state is .
A policy function is similar. Its input is a state-action pair, and its output is a probability:
Here:
- The in denotes the Cartesian product: the set of all state-action pairs.
- means the output range is the real interval from to , because probabilities live in this range.
- means the input is a state-action pair and the output is the probability of choosing action in state .
A function requires the same input to correspond to only one output. gives one value for each state, so it satisfies this requirement. The transition probability is also a function: the input is the current state, action, and next state, and the output is the transition probability.
Scalars, sets, and functions handle one-to-one relationships: one state corresponds to one value, and one state-action pair corresponds to one probability. But reinforcement learning often needs to handle many states at once. If an environment has thousands of states, writing every separately becomes cumbersome. Putting all state values into one column and operating on them as a whole gives us a vector.
Vectors
Suppose an environment has three states and the current value estimates are:
| State | Value |
|---|---|
| s1 | 3 |
| s2 | 5 |
| s3 | 2 |
Put all numbers into one column and treat them as a single object:
The three numbers inside the brackets are the components of the vector. is written in bold to distinguish it from a single scalar. Once vectors are introduced, we can operate on "the values of all states" at the same time.
Addition. Suppose every state receives an additional reward of . This is equivalent to adding to every component:
Vector addition adds components one by one. This requires the two vectors to have the same length. Vectors with different lengths cannot be added.
Scalar multiplication. Multiply every component of a vector by the same scalar. For example, applying discount factor gives:
This corresponds to discounting future value. In the Bellman equation , is this step: scale the future value by the discount factor before adding it to the immediate reward.
A vector can represent the values of all states, but it cannot represent how states transition into one another. From , the next state may be or , and this "from which state to which state, with what probability" relationship requires a matrix.
Matrices
Consider two states and :
- Starting from , the next state is always .
- Starting from , the next state is always .
This transition relationship can be written as a matrix:
Rows correspond to "which state we start from," and columns correspond to "which state we go to next." The first row says: starting from , the probability of reaching is , and the probability of reaching is . The second row has the analogous meaning.
If the current values of the two states are:
then the first component of is the value of , and the second component is the value of . Each row of the transition matrix is a probability distribution over next states. Multiplying a row by takes a probability-weighted sum of possible next-state values:
Putting the two row results back into a vector gives : the expected next-state value from each current state.
The result matches the transition rule: from the next state is , whose future value is ; from the next state is , whose future value is .
General Case
For three states, suppose the transition relationship is:
| Current state | to s1 | to s2 | to s3 |
|---|---|---|---|
| s1 | 0.1 | 0.7 | 0.2 |
| s2 | 0.0 | 0.3 | 0.7 |
| s3 | 0.5 | 0.5 | 0.0 |
Written as a matrix:
The number of rows and columns both equal the number of states . Moving from 2 states to 3 states changes the matrix from to , but the structure is unchanged: row always represents the probabilities of going from to every possible next state. This structure holds for any number of states.
Matrix Multiplication and Probability Weighting
So far we have placed state values into a vector and state transitions into a matrix. Now let us examine the computation inside matrix multiplication and why it exactly matches probability-weighted averaging.
Let
Then
Each row of the matrix takes one dot product with the vector. Matrix-vector multiplication is many weighted sums performed together.
Probability Weighting as a Special Case
In reinforcement learning, when transition matrix multiplies value vector , row says: starting from state , average the values of all possible next states using transition probabilities as weights.
A concrete example:
Then
The first row means: starting from , there is a chance of reaching a state with value and a chance of reaching a state with value , so the expected future value is .
The key property here is that every row of the matrix is a set of probabilities whose sum is . Therefore, matrix multiplication implements exactly "probability times value" weighted averaging. The Bellman equation is essentially "immediate reward plus discounted probability-weighted future value."
Matrix multiplication is not limited to probability matrices. In neural networks, rows of weight matrices usually do not sum to , but matrix multiplication is still weighted summation. Probability weighting is only one special case of matrix multiplication.
Dimension Checks
The simplest way to judge whether a linear algebra formula is valid is to check dimensions.
With states, the value vector is:
The state transition matrix is:
Therefore the shape of is:
The result is still a value vector. Thus
has matching shapes on both sides and is meaningful.
Shape Checks in Neural Networks
If a linear Q function is written as
then and must have the same length. If , then , so the dot product is a scalar.
Shape checking is just as important in neural networks. Consider a simple two-layer network:
input state features, 128 dimensions -> hidden layer, 64 dimensions -> action logits, 2 dimensionsThe weight matrix shapes are:
| Layer | Weight matrix | Shape |
|---|---|---|
| Layer 1 | W1 | 128 x 64 |
| Layer 2 | W2 | 64 x 2 |
Forward propagation:
is , input is , so is , and hidden state is also . is , so is , exactly two action logits.
Dimension checking is an effective way to read papers and write code. Many formulas look complicated, but checking input and output dimensions often reveals whether they are reasonable.
Common Pitfall
In matrix multiplication, , so the inner dimensions must match. If code raises RuntimeError: mat1 and mat2 shapes cannot be multiplied, some tensor dimension is usually wrong.
Summary
This article established five basic objects in linear algebra:
| Object | Role in RL | Example |
|---|---|---|
| Scalar | Single reward or hyperparameter | r=2, gamma=0.9 |
| Set | Possible states and actions | |
| Function | Value function and policy function | v(s), pi(a|s) |
| Vector | All state values together | v=[3, 5, 2]^T |
| Matrix | Transitions among all states | P in R^(n x n) |
Their relationships are: scalars form vectors, vectors form matrices, and matrix-vector multiplication implements probability weighting. The next article combines these objects into a full system of equations: the matrix form of the Bellman equation .
Next: D.1.2 Matrix Form of the Bellman Equation shows how vectors, matrices, and matrix multiplication combine into the matrix form of the Bellman equation.